
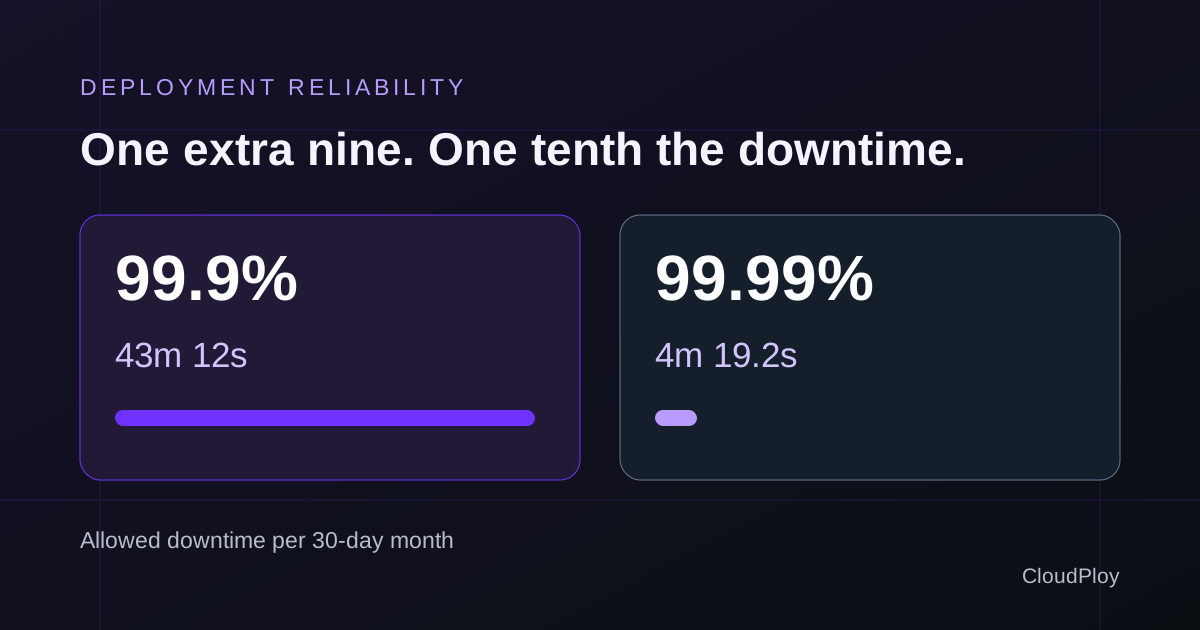
99.99% uptime permits one tenth as much downtime as 99.9%. In a 30-day month, that’s 4 minutes 19.2 seconds instead of 43 minutes 12 seconds. The extra nine changes how much time you have to detect a failed deployment and recover from it.
Use the free uptime calculator to choose a different month length or subtract downtime you’ve already recorded. The figures here are arithmetic examples, not a CloudPloy availability guarantee.
In this guide
- Compare the downtime budgets
- Separate SLA, SLO, and SLI
- Work through a failed deployment
- Choose a target
- Check the measurement rules
- Prepare your deployment process
How much downtime does each target allow?
The formula is allowed downtime = measurement window × (100 − uptime percentage) ÷ 100. Use the same time unit throughout the calculation.
| Uptime target | 30-day month | 365-day year |
|---|---|---|
| 99% | 7h 12m | 3d 15h 36m |
| 99.9% | 43m 12s | 8h 45m 36s |
| 99.95% | 21m 36s | 4h 22m 48s |
| 99.99% | 4m 19.2s | 52m 33.6s |
| 99.999% | 25.92s | 5m 15.36s |
These are independent windows. A monthly target doesn’t let you borrow unused downtime from the previous month. A yearly target could permit a long incident that would fail the same percentage measured monthly.
The month length also matters. At 99.9%, February with 28 days allows 40 minutes 19.2 seconds; a 31-day month allows 44 minutes 38.4 seconds. State the window whenever you quote an availability number.
What is the difference between an SLA, an SLO, and an SLI?
An SLI is the measurement, such as the proportion of eligible requests that succeed. An SLO is the target for that measurement over a defined window. An SLA is an agreement that specifies service expectations and may attach consequences, such as credits, to missing them.
For example, a team might measure successful checkout requests as its SLI, aim for 99.95% as its internal SLO, and offer a 99.9% contractual SLA. These numbers are illustrative. The team needs to define which requests count and what makes one successful.
A time-based error budget is the downtime the SLO permits. A request-based budget instead counts failed requests. Don’t convert one into the other without understanding traffic patterns: an outage during peak checkout traffic can affect far more customers than the same outage overnight.
Google’s service level objectives chapter explains the distinction. Its SLO implementation guide covers measurement and error-budget policies.
Can a manual rollback fit inside a 99.99% budget?
Sometimes, but a slow alert or a failed rollback can consume the whole month. Consider this hypothetical incident where the service is fully unavailable throughout:
| Stage | Time spent |
|---|---|
| Monitoring detects the failure | 1 minute |
| On-call engineer investigates | 2 minutes |
| Rollback restores service | 3 minutes |
| Total unavailable time | 6 minutes |
At 99.9%, that leaves 37 minutes 12 seconds in a 30-day budget. At 99.99%, it exceeds the budget by 1 minute 40.8 seconds. If another incident already consumed part of the budget, the margin is smaller still.
This doesn’t mean every four-nines service needs a particular architecture. It means you need measured recovery times. Time a rollback in staging, including application startup and health checks. Then test the dependencies that can make it fail, especially database schema changes.
For a self-managed Node.js service, the PM2 setup guide explains when cluster reloads can keep serving requests and when they fall back to a restart.
Its restart-vs-reload experiment includes five local trials per scenario and downloadable request-level data. Single-process restarts produced connection refusals; both two-worker cluster operations recorded zero failures in that synthetic setup. Those request counts aren’t monthly uptime measurements.
Our Docker deployment guide covers container deployment patterns. Use those patterns with a tested recovery procedure rather than treating a running container as proof that customers can use the application.
Should you choose 99.9% or 99.99% uptime?
Choose based on customer impact, contractual obligations, and demonstrated recovery capability. 99.9% leaves more room for manual recovery. 99.99% gives you a much smaller budget and may require faster detection, redundant dependencies, or automated failover.
Start with these questions:
- Which user action matters? A public status page being reachable doesn’t prove checkout works. Measure the path customers need.
- What does an interruption cost? Use your own sales, support, and contractual data. A generic revenue-loss estimate won’t tell you whether redundancy pays for itself.
- How long does recovery actually take? Include alert delivery, diagnosis, rollback, database recovery, and cache warmup where relevant.
- Who responds outside office hours? A four-minute monthly allowance and a next-business-day response policy don’t fit together.
- What do shared dependencies change? Two application servers can still fail together if they depend on the same database, region, or deployment mistake.
There is no universal price multiplier for another nine. A second server has a visible bill; maintaining failover procedures and staffing incident response also cost time. Compare the whole operating model.
Does planned maintenance count as downtime?
Only your measurement policy or agreement can answer that. Some SLAs exclude specified maintenance windows or require a minimum outage duration. Your customer-facing SLO can use different rules, but document the difference.
Check these definitions before comparing two providers’ percentages:
- Calendar month, rolling 30 days, or year?
- Entire service unavailable, elevated errors, or requests slower than a threshold?
- Measurement from the provider’s network or from the customer’s path?
- Maintenance included or excluded?
- One instance, one region, or the entire service?
- Credits automatic or subject to a claim deadline?
The uptime calculator counts the downtime you enter without excluding maintenance. If your policy excludes a period from both eligible time and downtime, calculate against that adjusted window rather than subtracting the outage alone.
What should you check before tightening your target?
- Put an external check on an important user journey. Keep its measurement definition stable so month-to-month comparisons mean something.
- Record incident start and recovery times, including partial failures where your SLI counts them.
- Rehearse rollback with the previous application version and a compatible database schema.
- Restore a backup into a separate environment and measure the recovery time. A backup job succeeding doesn’t prove the restore will work.
- Define what happens when the budget is exhausted. For example, pause risky changes while the team fixes repeated failures.
If you’re scheduling backup or verification jobs, the cron expression parser helps check their schedule. For the deployment workflow itself, see how CloudPloy works.
Does 100% uptime mean zero downtime?
In the arithmetic, yes: a 100% target has a zero error budget. It doesn’t prove that a system will never fail. A contract may also include exclusions, so read its definition of availability.
Can a 99.99% host guarantee 99.99% application uptime?
No. Application errors, DNS, database failures, and external services can make the application unavailable while the host remains healthy. Measure the service from the user’s perspective as well as monitoring infrastructure.
How do I calculate achieved uptime after an outage?
Use (window length − downtime) ÷ window length × 100. If you recorded 60 minutes of downtime in a 30-day month, availability was about 99.8611%. Enter the full window and its downtime in the calculator to check your own figures.